
2.2 Impact monitoring tools and gaps
The previous section lays out the main trajectories, dimensions and drivers of the transmission of disaster impacts across agrifood systems, and the challenges of measuring these impacts. In principle, assessing disaster impacts on agriculture would require some form of measurement – economic or non-economic – of the negative consequences experienced in all the affected components of agrifood systems. However, undertaking such an assessment – especially at the global scale – is problematic owing to the lack of relevant, consistent, up-to-date and reliable data; the complex and interconnected nature of agrifood systems; and the potential for localized disaster events to have widespread or indirect consequences. As a result, substantial gaps remain in our ability to measure and quantify the full scope of how disasters affect agrifood systems, which constrains our understanding of disaster consequences and limits the effectiveness of response and recovery efforts.
Efforts are being made to address this gap, and methodologies for assessing disaster impacts in agriculture have evolved significantly over recent decades, incorporating lessons learned from major disaster events, advances in scientific understanding of agricultural systems, and improvements in data collection and analysis technologies. Data limitations and the absence of specialized repositories for documenting disaster impacts on agrifood systems present the primary challenge for undertaking loss evaluations. Current assessment approaches therefore focus primarily on assessing immediate economic losses and cannot yet account for the complex, indirect and cascading effects that ripple through interconnected agrifood systems after a disaster event. Although this leads to a systematic underestimation of disaster impacts on agriculture, these loss assessments serve as foundational frameworks for identifying vulnerabilities and allocating resources for recovery and resilience-building.
GLOBAL MONITORING FRAMEWORKS AND IMPLEMENTATION
Specialized agricultural assessment tools have been developed to address specific aspects of disaster impacts but are often limited to specific hazards, impact types or agricultural subsectors. The following section outlines the two principal tools available for monitoring the impact of disasters at a global scale that also contain information on sectoral losses in agriculture.
Sendai framework monitor indicator C2
The Sendai Framework for Disaster Risk Reduction 2015-2030 provides the primary global framework for monitoring disaster impacts and tracking progress towards reducing disaster risk and losses. Its indicator system aims to standardize impact measurement across countries and sectors, with Global Target C specifically formulated to measure direct economic losses caused by disasters in relation to global gross domestic product.71 Agricultural losses are a critical component of Target C, and FAO has provided support to the UNDRR for the development of a methodology for reporting direct agricultural losses attributed to disasters under the C2 indicator of the Sendai Framework Monitor.72 The methodology provides standardized definitions and assessment indicators that enable subsectoral analysis, cross-country comparison and global aggregation of disaster impacts in agriculture.
The indicator system relies on voluntary annual reporting by Member States through the Sendai Framework Monitor, creating a baseline and longitudinal datasets that support comparative analysis and progress tracking of disaster losses over time. The implementation of the Sendai Framework Monitor reveals progress in efforts by countries to establish standardized monitoring systems and develop national disaster loss databases for systematic impact monitoring. But it also highlights persistent challenges in data collection and analysis, as well as the institutional capacities of countries that limit the scope of global monitoring efforts. While agricultural loss reporting by member states has expanded since the framework’s adoption, with a total of 87 countries reporting at least once under indicator C2 since 2015, the overall number of reports is relatively low and the number of countries reporting has considerably declined in recent years (see FIGURE 1).
FIGURE 1 Number of countries reporting under Sendai Framework indicator C2
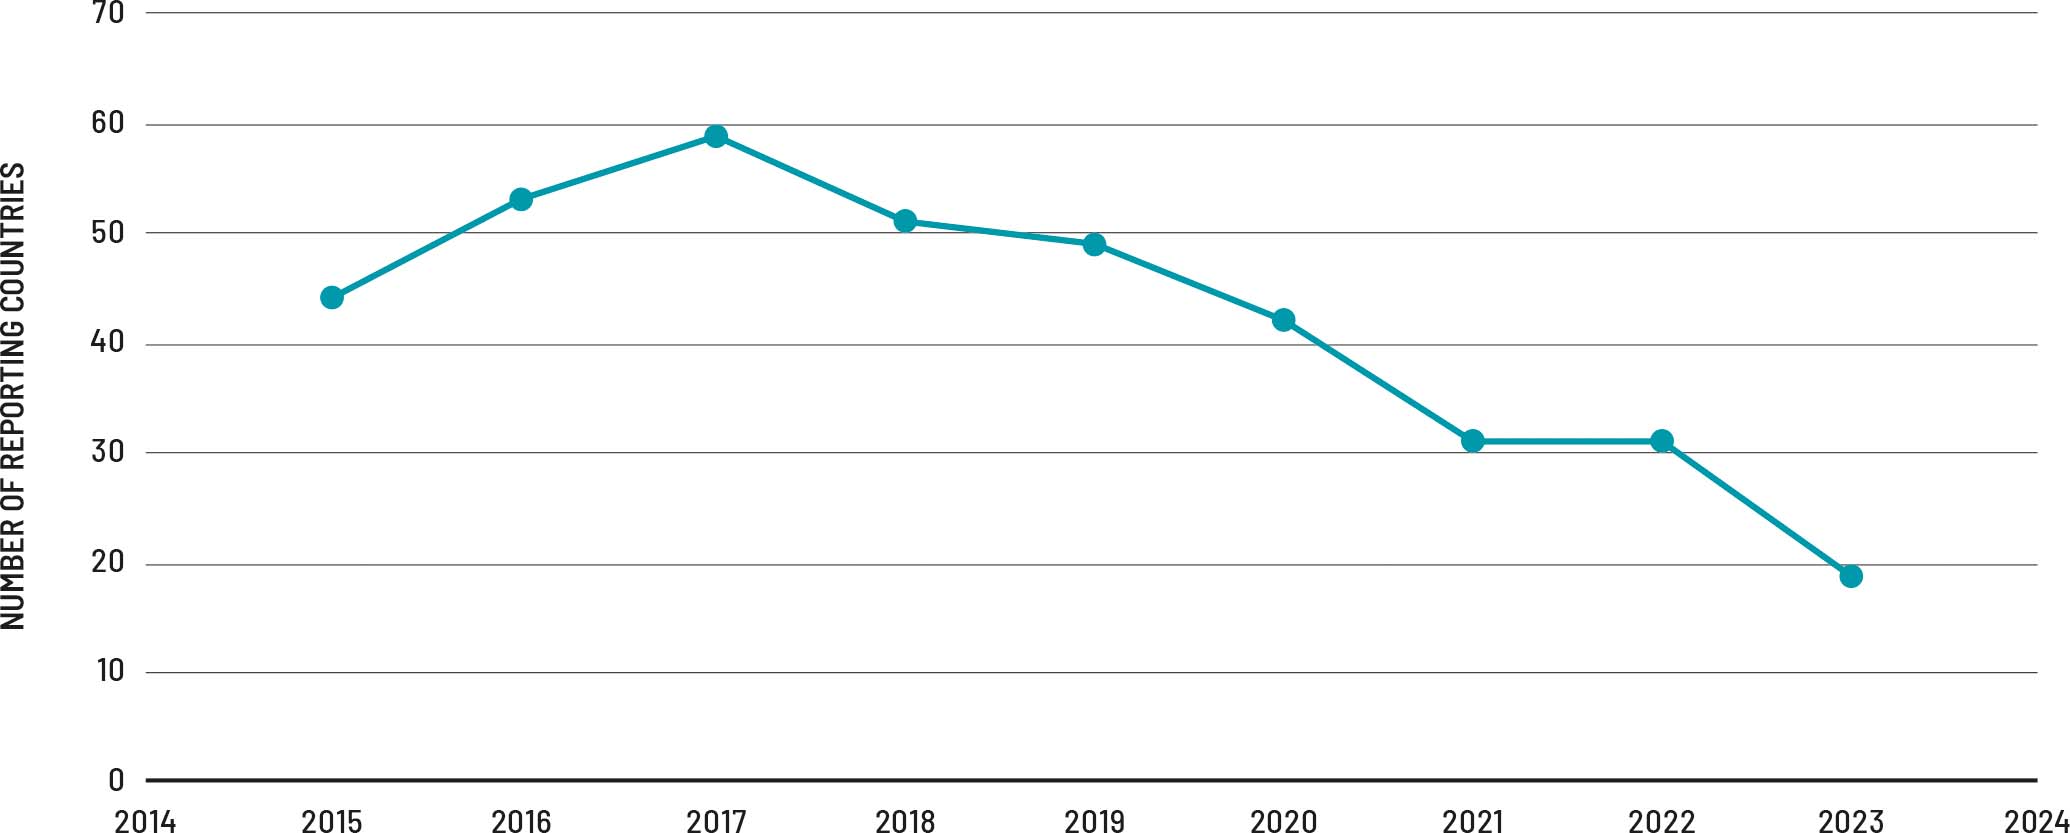
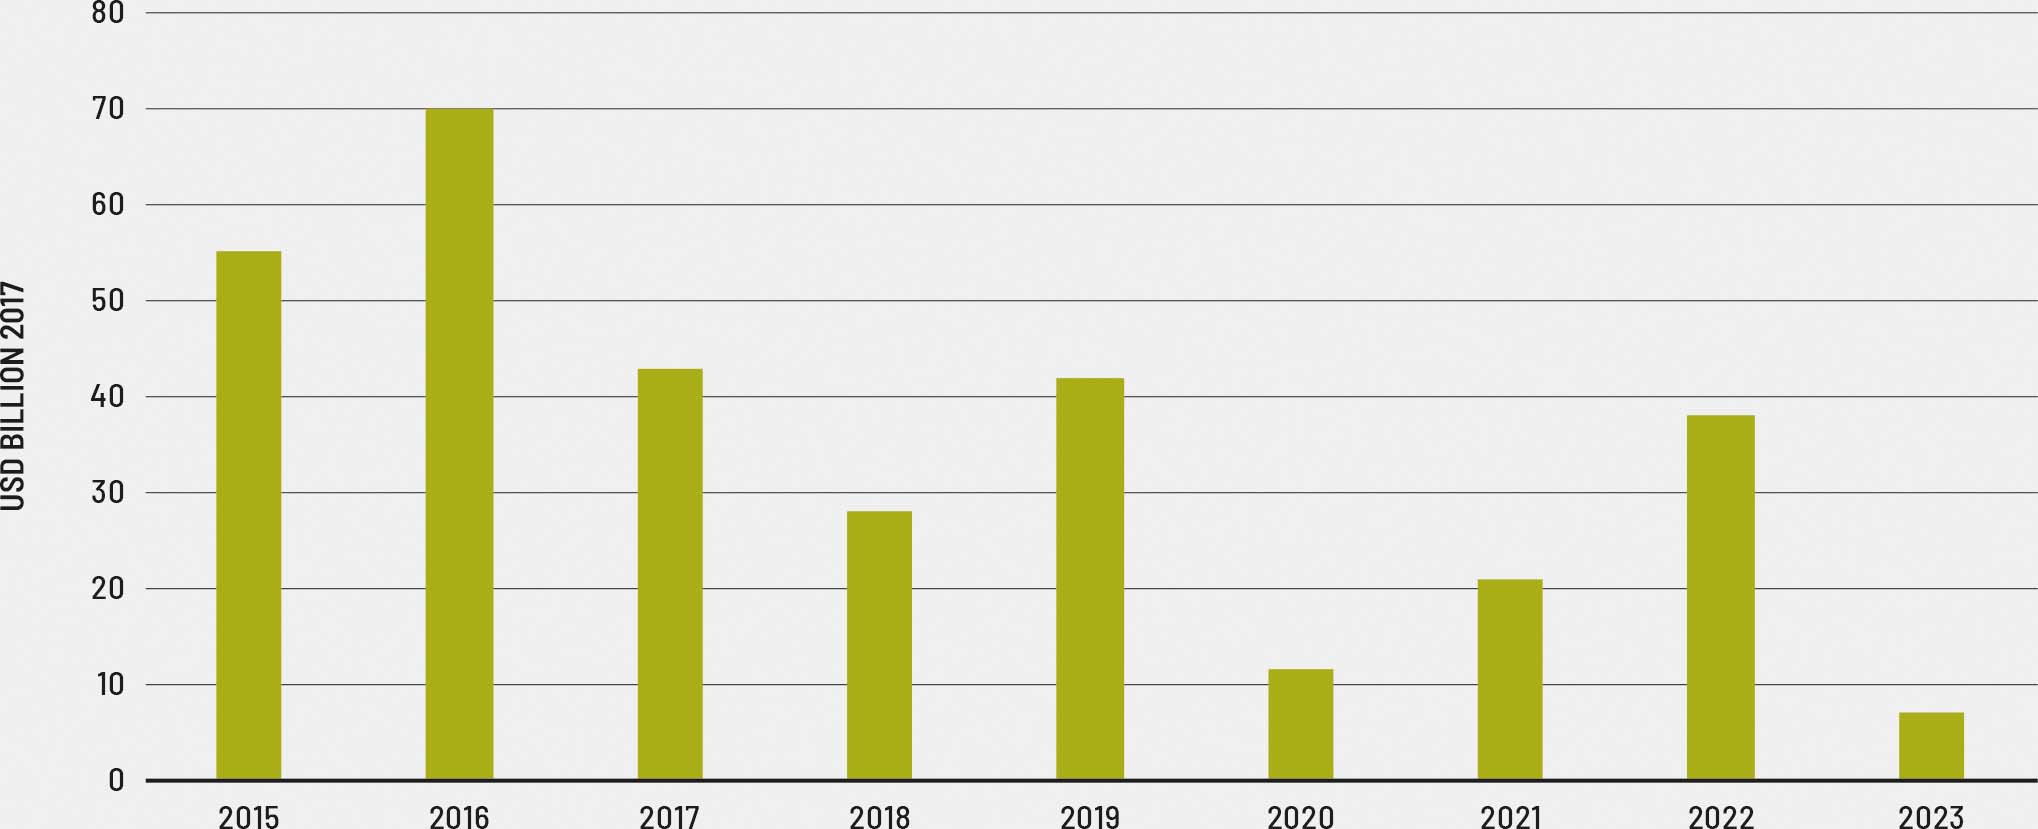
Substantial gaps in country coverage, data quality and reliability, and analytical capacity constrain the effectiveness of global monitoring systems, such as the Sendai Framework Monitor. In parallel with tools for monitoring losses, countries need support in increasing technical capacity, financial resources, and establishing institutional frameworks necessary for systematic monitoring and assessment of disaster impacts. Without these, there are likely to be significant data quality variations in the reported information, limiting the reliability and comparability of data and resulting in significant underreporting and underrepresentation of disaster impacts in agriculture. The losses declared under the C2 indicator (FIGURE 2) are therefore informative but not necessarily representative of agricultural loss trends at a global level due to inconsistent and under-reporting of data.
FIGURE 2 Agricultural losses declared under Sendai Framework indicator C2
Although the C2 indicator reporting structure allows for the possibility to report disaggregated values for vulnerable groups, geographic areas and impact types, there is limited reporting by countries under these categories. The data also allows for the disaggregation of losses by hazard types (FIGURE 3), however, only 10 percent of countries have provided information on the type of hazard associated with reported agricultural losses. The information is therefore partial and incomplete, but it still points to the dominance of hydrometeorological events such as storms, floods, heatwaves and droughts in afflicting losses in agriculture.
FIGURE 3 Share of impact by hazard type declared under Sendai Framework indicator C2, 2015–2023

As the C2 indicator was designed to capture direct economic losses in agriculture, it does not include indirect effects, non-economic losses and longer-term consequences that may be more significant than immediate damages. To address this gap, the UNDRR launched the Disaster and Hazardous Events, Losses, and Damages Tracking and Analysis System (DELTA Resilience) in June 2025 to provide a more comprehensive and methodologically advanced tool for recording disaster losses.73 The new tool, discussed in greater detail in Part 3 of the report, is a groundbreaking collaboration between UNDRR, the United Nations Development Programme (UNDP), and the WMO that will replace the legacy DesInventar platform with a comprehensive, interoperable solution that tracks both hazardous events and disaggregated losses at localized scales.
The system’s foundation rests on building synergy with the WMO-CHE methodology, creating unprecedented connections between meteorological observations and disaster impacts, including cascading effects across multiple sectors. A key innovation is the DELTA Resilience system’s emphasis on institutional collaboration. Linkages and enhanced collaboration between the national disaster management offices (NDMOs), the national hydro-meteorological services (NHMS), and the national statistics offices (NSOs) extend the losses and damages data value chain to support improved analytical options and enable data use. This multi-agency approach addresses the fragmented nature of conventional disaster data collection.
The system incorporates advanced technological solutions designed for varying digital maturity levels. Technology tools such as application programming interfaces (APIs) and post-processing tools will be part of the digital technology solutions available to enable countries to migrate and map historic data to new classification and data standards. The tool will be made available to Member States as a downloadable software system to establish country-owned, institutionalized and contextualized national losses and damages tracking systems.
Post-disaster needs assessments
PDNAs offer an international survey structure for the comprehensive assessment of disaster impacts and recovery needs across multiple sectors, with specialized approaches developed for agricultural sector assessment that integrate physical damage evaluation with socioeconomic impact analysis and recovery planning. The methodology provides a harmonized approach for disaster impact assessment through standardized frameworks that capture damage to physical assets, losses in economic flows, human impacts on affected populations, and recovery needs for restoration and improvement of affected systems.74
The PDNA survey follows established phases, including preparation, field assessment, analysis, and reporting that ensure systematic and comprehensive evaluation of disaster impacts while building national capacity for disaster assessment and management. Government leadership ensures national ownership and policy relevance while multi-agency participation brings diverse technical expertise and resources to assessment efforts. Standardized questionnaires enable rapid deployment of assessment teams while ensuring consistency and quality of results across different contexts and disaster types.
Agricultural sector applications include specialized assessment protocols for crops, livestock, fisheries and aquaculture, and forestry subsectors that account for the unique characteristics and vulnerabilities of each agricultural activity while providing standardized approaches for quantifying impacts and identifying recovery priorities. Although the information contained in PDNAs is not representative due to the limited number of surveys conducted – usually in low-income countries and after the most damaging disaster events – the availability of information on sectoral losses allows for comparison between the cost inflicted by disasters in different economic sectors. Findings from 96 PDNAs undertaken during the 2007–2024 period in 63 countries (see Annex 1) show that agricultural losses make up an average of 23 percent of the total impact of disasters across all sectors (FIGURE 4).
FIGURE 4 SHARE OF SECTORAL LOSSES

Source: Authors’ own elaboration based on data derived from PDNAs.
Data from PDNAs can also help assess how different hazards impact agriculture, although such data must be interpreted with caution due to their inherent limitations. Since PDNAs are conducted only after select disaster events, their utility as a systematic data source is limited, especially for estimates of disaster-induced losses across the full spectrum of hazard types. Additionally, the extent of agricultural losses after each disaster event is context-specific and can vary depending on several factors, including the type and strength of the hazard, its timing relative to crop cycles, and the specific ecological and geographical setting. Notwithstanding these limitations, data from PDNAs indicate that while floods cause the greatest total economic damage to agriculture (see FIGURE 5), droughts result in the highest proportion of loss within the sector, accounting for nearly 80 percent of agriculture’s share of losses compared to other economic sectors (see FIGURE 6). This finding is significant because droughts are typically underreported in disaster databases like the EM-DAT, and far fewer PDNAs have been conducted following drought-related disasters than after floods or storms. If more PDNAs were carried out in response to drought events, the reported agricultural losses would likely be substantially higher.
FIGURE 5 ECONOMIC LOSS IN AGRICULTURE AND NON-AGRICULTURAL SECTORS BY HAZARD TYPE (VALUE)

Source: Authors’ own elaboration based on data derived from PDNAs.
FIGURE 6 ECONOMIC LOSS IN AGRICULTURE AND NON-AGRICULTURAL SECTORS BY HAZARD TYPE (SHARE)

Source: Authors’ own elaboration based on data derived from PDNAs.
Overall, the PDNA survey constitutes a resource-intensive exercise that requires significant technical expertise, time, and financial resources that may not be readily available following major disasters when immediate response needs compete for attention and resources. The focus on immediate post-disaster periods may also miss longer-term agricultural impacts that emerge over months or years following initial events, particularly for perennial crops, livestock breeding stock and ecosystem services that require extended periods for recovery or may experience delayed effects. Recent efforts to revise the methodology include consideration of slow-onset events and gradual environmental processes that may cause cumulative damage, and recognition of non-economic losses and indirect effects that significantly affect community resilience and recovery capacity.


