
3.2 From early warning to resilient action
The digital tools and technologies examined in the previous section provide the foundation for transformed risk management, yet their true value emerges only when they translate into timely, effective action that protects lives and livelihoods. This section examines how digital innovations enable the critical shift from reactive response to proactive prevention—demonstrating how early-warning systems inform anticipatory actions, how predictive analytics guide decision-making before disasters strike, and how integrated digital platforms support the building of long-term resilience. By exploring the operational deployment of these technologies across disease surveillance, pest monitoring, food security assessment, and risk transfer mechanisms, we reveal the practical pathways through which digital transformation delivers measurable benefits to farmers and communities facing mounting disaster risks.
Digital technologies support early-warning systems in offering insights that enable policymakers and communities to take anticipatory actions. EWS can save lives and assets that are worth at least ten times their costs.156 For every USD 1 invested in anticipatory actions, FAO estimates that rural families can gain up to USD 7 in benefits, including avoided agricultural losses.83 There has been a shift towards recognizing the importance of multihazard early-warning systems (MHEWS) in managing risks and their impacts across sectors and systems, including agrifood systems. Effective MHEWS are people-centred and inform vulnerable communities of anticipated risks and crises towards taking appropriate DRR actions. The United Nations Early Warnings for All initiative brings together the broader United Nations system, governments, civil society and development partners across the public and private sectors to enhance collaboration to address gaps and deliver people-centred, end-to-end MHEWS.157 Initiatives to better forecast hazards and their impacts and deliver critical information, ultimately translate into more effective policies and actions for increasing the resilience of farmers and agrifood systems.
EARLY-WARNING SYSTEMS AND SURVEILLANCE
The spread of transboundary pests and diseases is of growing concern. Climate anomalies increase the risk of transmission due to expanding breeding environments of vectors, or prolonged and unseasonal periods of transmission. Digital technologies can integrate multiple layers of information into disease and pest monitoring systems to provide a better understanding of these biological hazards and elevate the predictive power and functionality of EWS. This permits planners to anticipate outbreaks more effectively and reduce the likelihood of widespread destruction.
Disease surveillance and monitoring systems
To be an effective part of the decision-making system, the data gathered often requires authoritative analysis and processing. FAO and the World Health Organization (WHO) underline the importance of promoting digital solutions for accelerating disease identification, reporting, warning and diagnosis. For example, the direct and indirect impact of FMD on agriculture has been estimated to be between USD 6.5 and USD 21 billion.158 The World Organisation for Animal Health (WOAH) and FAO support the control and monitoring of FMD to reduce related impacts. The complexity of tracking and controlling a transboundary disease such as the FMD virus requires a significant amount of epidemiological data.
Conveying up-to-date information about critical events in near real time is crucial for effective disease control and prevention. New technologies have revolutionized pathogen surveillance, with advanced computational tools and AI enabling real-time data collection from diverse sources, facilitating rapid outbreak identification and tracking. The FAO World Reference Laboratory for FMD and EuFMD developed the OpenFMD platform to facilitate global FMD surveillance and share data via analytical tools such as FMDbase,159 FMDtype,160 FMDwatch,161 PRAGMATIST162 and FMDnext. These tools leverage genetic and epidemiological data to enhance understanding of FMD evolution and spread. OpenFMD addresses data gaps, improves transparency and supports evidence-based decision-making. These exemplify how integrating digital technologies and open data in pathogen surveillance enhances our ability to detect outbreaks early and respond swiftly, which ultimately reduces impacts.
Low-cost, accessible, centrally-maintained digital solutions enhance pest identification, control, surveillance and data collection. FAO supports disease monitoring with real-time information systems such as EMA-i+, EIOS and GLEWS+. The Event Mobile Application (EMA-i) is free and available to countries seeking to adopt digital reporting systems for animal disease. EMA-i helps bridge the digital gap by supporting more than 4 000 users in 15 low-income countries who have reported over 60 000 disease suspicions to the veterinary services in the last three years. By using EMA-i, authorities become aware of these events as soon as they are notified, with digital systems connecting all levels of governmental preparedness and response in real-time.
FAO has also made available the EMPRES Global Animal Disease Information System (EMPRES-i+). An early warning team monitors weekly information collected through the over 130 FAO country offices, complemented with media scanning with the EIOS tool, developed by WHO. FAO uses EIOS to scan media for potential signals of animal diseases and makes the collected information publicly available in EMPRES-i+. Animal health threat updates are also discussed weekly within FAO’s network to improve awareness and preparedness around the globe.
When the global system detects disease alerts with possible zoonotic potential, the information is shared with WHO and WOAH. The Joint FAO–OIE–WHO GLEWS+ stands as a critical defence for global health. Between 2018 and 2023, 243 events covering 20 zoonotic diseases were reported using the platform, allowing information to be shared among the three partner organizations. In 2021, GLEWS+ conducted a joint risk assessment for SARS-CoV-2 transmission in fur farms. This assessment helped countries better manage disease risk and improve surveillance.
In Cambodia, efforts are ongoing to use disease surveillance innovations, providing lessons to address region-specific challenges. The concept of “smart markets” leverages cutting-edge technologies to enhance surveillance in traditional food markets – hotspots for zoonotic spillovers – by providing timely, actionable data for stakeholders. FAO deployed air samplers in conjunction with metagenomic analysis to capture high-resolution data on pathogen presence and diversity in traditional food markets. These surveillance data are comparable to, and in some cases even more comprehensive than, traditional methods involving the sampling of chickens and ducks. This highlights the efficiency and robustness of this technology in detecting endemic and emerging pathogens in complex environments. However, further evidence is necessary to support investments, effective communication strategies and addressing disparities in digital readiness.
Pest monitoring and early-warning systems
The fall armyworm (Spodoptera frugiperda) is a highly mobile transboundary pest that originates in the Neotropics and can cause a significant loss in a wide range of food, feed and fibre crops. Following its initial detection in West and Central Africa in 2016, FAW spread swiftly across Africa, the Near East, and Asia and the Pacific, affecting crops, imperilling food and livelihood security, and driving pesticide abuse. At that time, there was limited knowledge about FAW’s behaviour outside its native range. Therefore, to provide timely and accurate data on FAW and its ecology and spread in new habitats, FAO developed the FAMEWS,163 with information and communication technology (ICT) support from PlantVillage at Penn State University (FIGURE 26).164
FIGURE 26 The FAMEWS working concept/data flow mechanism
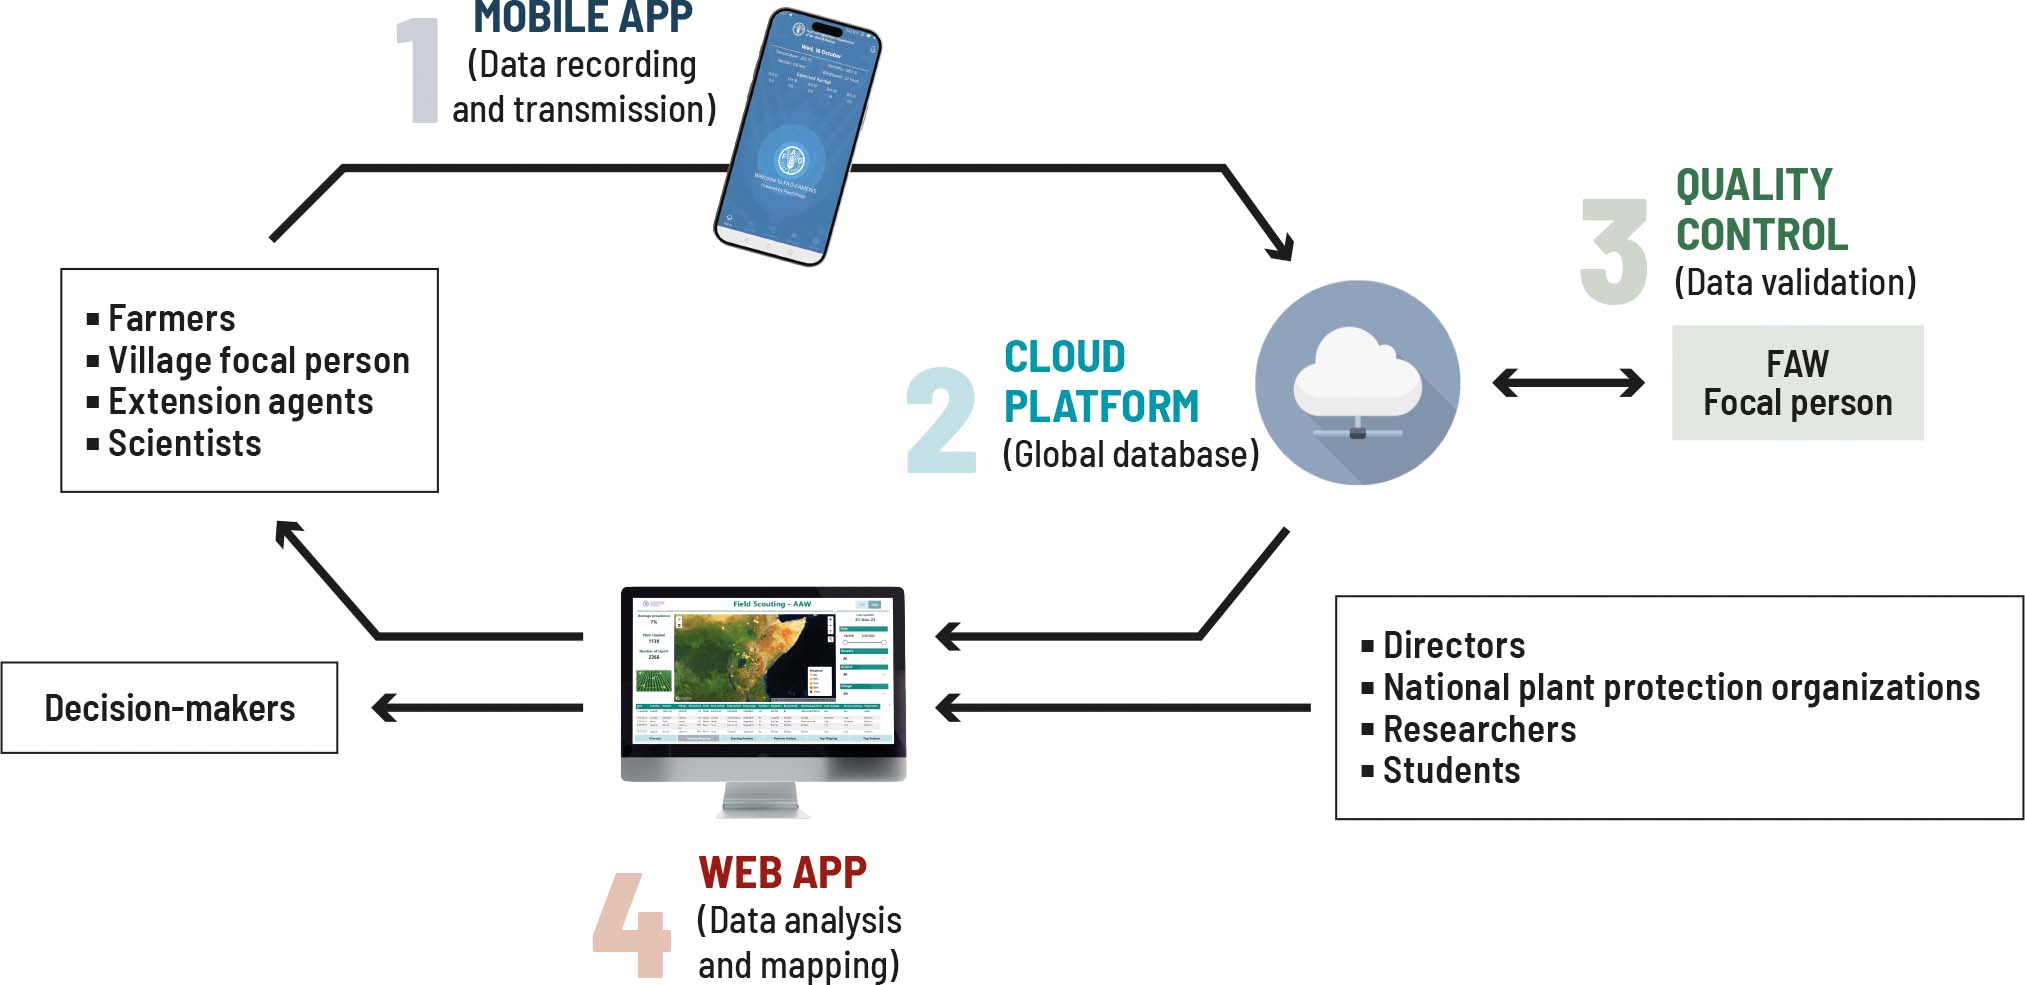
This integrated system uses field scouting and pheromone traps to monitor FAW. It includes a mobile app for data collection, a cloud-based database, and a global platform for mapping and analysing the information, making it accessible to users. Field-collected data are instrumental in monitoring FAW infestation levels and dynamics across the FAW invasive range, establishing risk zones and steering risk management interventions. Beyond monitoring FAW spread, FAMEWS also connects stakeholders, offering farmers free advice, open-access resources and AI-based FAW identification. FAMEWS is also linked to the global PlantVillage network, giving users access to information on other pests and diseases.
FAMEWS provides tailored decision support through actionable insights supported by pest management protocols and guidance. It establishes a coordinated response to contain the spread of FAW. First, FAMEWS offers a mobile app and a global platform for real-time data collection and analysis, enabling farmers, community focal points and extension agents to report FAW infestations promptly. This facilitates the rapid dissemination of information and allows for timely interventions to reduce crop damage. Second, the data are validated by local staff and analysed to generate detailed maps and reports, supporting decision-making at the farmer, community and national levels. Third, FAMEWS offers training materials, expert guidance and a digital library to promote the adoption of IPM practices, which control FAW populations while reducing reliance on highly hazardous pesticides, thereby supporting biodiversity, environmental sustainability and human health. Fourth, the app includes chat functions and expert resources, fostering collaboration in FAW management and strengthening local resilience. Fifth, it is user-friendly and accessible, with offline functionality and availability in 29 languages, ensuring reach to farmers in remote areas. FAMEWS data are open-access, providing valuable insights to a wide range of users and promoting the exchange of best practices.
Since its launch, FAMEWS has processed data from over 50 000 field scouting events and over 16 000 pheromone traps in more than 60 countries, forming the foundation for advanced forecasting models, EWS and decision support tools at the farm level.165 FAMEWS has been crucial in improving EWS, preparedness, and decision-making capacities and processes in 18 African countries. Five countries (Burkina Faso, Cameroon, Ghana, Kenya and Mozambique) have reported reduced infestations and associated yield losses. The FAO Global Action for FAW Control continues to promote the FAMEWS for pest monitoring, risk assessments and the implementation of sustainable management practices. Beyond mitigating the pest-related impacts, this approach also bolsters the long-term resilience and sustainability of agricultural systems.
Vector-borne disease early-warning systems
The Rift Valley Fever Early Warning Decision Support Tool (RVF-DST) is another example of an EWS that promotes innovative use of data layers, digital technologies and advanced analytics. Rift Valley fever is an acute, climate-sensitive, vector-borne viral zoonotic disease that significantly impacts livelihoods, markets and human health.166 Currently confined to Africa and parts of the Near East, it has the potential to spread globally, primarily by mosquito bites (particularly Aedes and Culex species, and secondarily Anopheles species). RVF affects humans and animals like sheep, goats, cattle, buffalo and camels. Early detection and anticipating outbreaks are critical given that the disease causes high mortality in young animals and leads to high abortion rates.167,168 RVF poses challenges for surveillance because, in endemic regions, it circulates subclinically among animals and mosquitoes. Infected mosquito eggs can survive for years during dry periods, making eradication unfeasible with current methods.
As mosquito populations increase after flood events, RVF is amplified in livestock herds, leading to outbreaks during these periods. Consequently, RVF outbreaks are strongly associated with climate anomalies that lead to these events (including phenomena like El Niño) and further compounded by climate change.169 Due to the severity and impact of RVF on livestock herds, and the consequential economic impact on agriculture and livelihoods, EWS are essential for helping national authorities implement proactive measures to enhance detection, prevention, and response efforts, and are initiated following RVF alerts. This includes enhanced risk-based surveillance, deployment of sentinel herds, well-equipped laboratories for accurate diagnostics, targeted vaccination campaigns and improved readiness through updated contingency plans.170
FAO monitors and forecasts RVF in African countries with the web-based RVF-DST. This integrates real-time risk maps, historical data, and expert knowledge and provides monthly and eight-day risk updates for the African continent.171 Risk mapping modelling has progressed from snapshots of RVF’s ecoepidemiology across different ecosystems to a dynamic model that tracks the evolution of RVF risk over time and identifies climate variations that influence vector dynamics.172,173,174
The RVF-DST integrates multiple data sources for continuous monitoring of RVF risk, including climate; livestock and wild herbivore populations susceptible to the virus; past and current RVF occurrences; human populations; marketplaces; road networks; animal trade routes; water bodies and irrigation areas; land cover; and soil characteristics. The RVF-DST is also integrated into the Agro-Informatics geospatial platform to enhance the interoperability of FAO’s geospatial data and ensure cost-effective maintenance and sustainability of FAO applications.
The RVF-DST provides a risk map, using proxy measures, to highlight areas of potential risk of RVF Vector Amplification. It also allows spatial analysis on polygons or points or subnational administrative boundaries, namely: comparison of monthly precipitation (total and cumulative) with long-term averages; historical distribution of land under normalized difference vegetation index (NDVI) anomalies; quantity of human and livestock population at risk (in areas with identified NDVI anomalies); and multifactor radar charts of features that are relevant in areas presenting NDVI anomalies.
The RVF-DST also supports custom data uploads and trend tracking of RVF risks with comparative charts. Features include printable reports, metadata links, real-time data sharing, and story maps for early warning, with content available in English and French. Future innovations and planned features include the integration of multicriteria decision analysis (MCDA) into the tool to enhance risk categorization linked to informed actions/recommendations, and accessing the RVF-DST via FAO’s EMPRES-i+ interface. EMPRES-i+ provides updated animal disease information at the national, regional and global levels, supporting early warning and response to transboundary animal diseases like RVF.
To integrate the RVF-DST into governance pathways, supporting processes are required, including training to optimize its use for real-time data sharing, environmental risk monitoring and disease forecasting. A monthly verification and alert determination process follows, during which a panel of experts at the national, regional and global levels conducts a qualitative risk assessment combining real-time data from the RVF-DST with local sources and expert knowledge to verify results and determine whether conditions warrant an RVF alert. The results, along with a three-month risk prediction, are included in the weekly internal FAO Animal Health Threat Update (AHTU) and shared with stakeholders for informed action; and continuous monitoring with satellite technology and high spatial and temporal resolution data.
The RVF-DST has been successfully applied in major RVF outbreaks in the United Republic of Tanzania (2007), Kenya (2018) and Uganda (2018 and 2024).161 In the United Republic of Tanzania, heavy rainfall in late 2006 led to increased vector amplification suitability, with a two-month lag before the outbreak in February 2007. In Kenya, heavy rainfall from February to April 2018 caused a spike in vector amplification suitability, followed by the first outbreaks in late May/early June. In Uganda, similar patterns occurred in 2018 and 2024, with joint FAO-IGAD alerts issued 2–3 months before the outbreaks. In the United Republic of Tanzania, risk-based sero-surveillance was conducted in high-risk areas, with results suggesting RVF is endemic in the surveyed areas.
Collaboration with government bodies, regional cooperation and local capacity building have been emphasized as a success factor. For example, following the FAO-IGAD joint alert of May 2024, Rwanda initiated proactive, nationwide risk-based vaccination campaigns to mitigate the risk of an RVF outbreak. By August 2024, the only reported outbreak remained confined to Ngoma district, affecting a limited number of animals over a short period. The restricted nature and duration of the RVF outbreak are credited to the pre-emptive vaccinations aligned with the alert’s recommendations using a One Health approach.
These examples highlight how combining digital tools, surveillance, and expert validation strengthen disaster response through collaboration between FAO, national veterinary services and regional partners. To further enhance the RVF-DST’s capacity, additional data on agricultural losses from RVF outbreaks are needed, such as livestock mortality, economic impacts on trade and tourism, and costs to agricultural industries.
Since 2018, FAO has issued 19 RVF alerts in Africa, 16 of which were jointly issued with IGAD for Eastern Africa, providing information on risk areas and guidance on mitigation and control measures.175 FAO has also developed manuals on RVF prevention, control and national contingency planning, along with an action framework. A key part of FAO’s work involves building the EWS capacities of countries. To address technical gaps, FAO has been delivering a training programme on the use of the RVF-DST at both the regional and country levels since 2021.
Food security and nutrition early warning
The Integrated Food Security Phase Classification (IPC) was developed in 2004 by FAO’s Food Security and Nutrition Analysis Unit (FSNAU) to help flag potential hunger hotspots and provide a common scale for classifying the severity and magnitude of food insecurity and acute malnutrition.176 The global partnership has evolved to include 20 other organizations involved in improving food security and nutrition analysis.177 The IPC provides a standardized framework for classifying the severity and magnitude of food insecurity and malnutrition, facilitating better decision-making and resource allocation.178 Since 1999, the Permanent Interstate Committee for Drought Control in the Sahel (Comité permanent Inter-Etats de Lutte contre la Sécheresse dans le Sahel, CILSS) along with the Economic Community of West African States, West African Economic and Monetary Union, United Nations agencies (FAO, WFP, the United Nations Children’s Fund), non-governmental organizations (Action Against Hunger, Save the Children and Oxfam), and Famine Early Warning Systems Network (FEWS NET), developed and implemented the Cadre Harmonisé (CH) for the analysis and identification of areas and populations at risk of food and nutrition insecurity in the Sahel and West Africa.
With subsequent lockdowns, the IPC Information Support System (ISS) ensured that the work in assessing and analyzing food insecurity could continue. The ISS ensured that large amounts of data could be shared among experts, which is necessary for an IPC analysis, and enabled more rounds of analysis than in the past, reducing costs associated with centralized gatherings of experts and speeding up the processing of information. This digital solution may have been one of the most impactful advances of the IPC in terms of resilience to changing work environments because of the COVID-19 pandemic. Webinars and e-learning modules also ensured knowledge creation and sharing. Other digital tools, such as CATI, facilitated remote data collection and helped ensure that data for decision-making are up to date, relevant, sufficiently comprehensive and granular. The IPC/CH also developed an API to facilitate integration into other platforms such as Strata,179 HiH initiative180 and Food Systems Dashboard.181
IPC/CH is built on data-driven consensus between decision-makers for advocacy and action purposes. People and their engagement are therefore central to IPC/CH. The way digital innovations have been integrated into the platform reflects this principle well, even in the context of exploring the role of AI and ML. The use of AI in IPC is being explored to improve efficiency and to increase the coverage and frequency of analyses. Rather than positioning AI as a central tool for classification, the focus is on how it can support experts by automating data processing and summarization, and by flagging geographic areas that may warrant further investigation/updated classifications. This experience with AI in IPC demonstrates how digital tools can streamline established processes, improving efficiency and enabling more timely and targeted analyses. At the same time, it highlights the ongoing need for expert capacity development, consensus building and decision making to ensure AI effectively supports and complements human expertise.
AI systems, however, rely heavily on the availability of high-quality, standardized and granular data to function effectively. Combining human expertise with AI to build a collective intelligence paradigm and ensure context-appropriate interventions can help address data and capacity gaps and significantly support DRR efforts.
ANTICIPATORY ACTION AND RESPONSE
Enhanced risk monitoring platforms
Advanced technical tools, such as geospatial dashboards combined with remote sensing analysis, offer innovative solutions for identifying high-risk areas, supporting smallholder farmers with actionable insights and laying the groundwork for future EWS. For instance, the development of the Agricultural Monitoring Platform (AMP) for the Sudan (see FIGURE 27), a dashboard for monitoring land and water-related risks, can help the country identify vulnerable regions for enhancing DRR and agricultural resilience.182 The dashboard was developed to analyse risks at a watershed level, a granular spatial scale directly linked to flood risks and agricultural morphological patterns. It integrates a comprehensive array of datasets, including state-wide project coverage, land cover classifications, climate indicators, flood history, security incidents, socioeconomic data and population statistics.
FIGURE 27 Overview of the agricultural monitoring dashboard and FAO project coverage
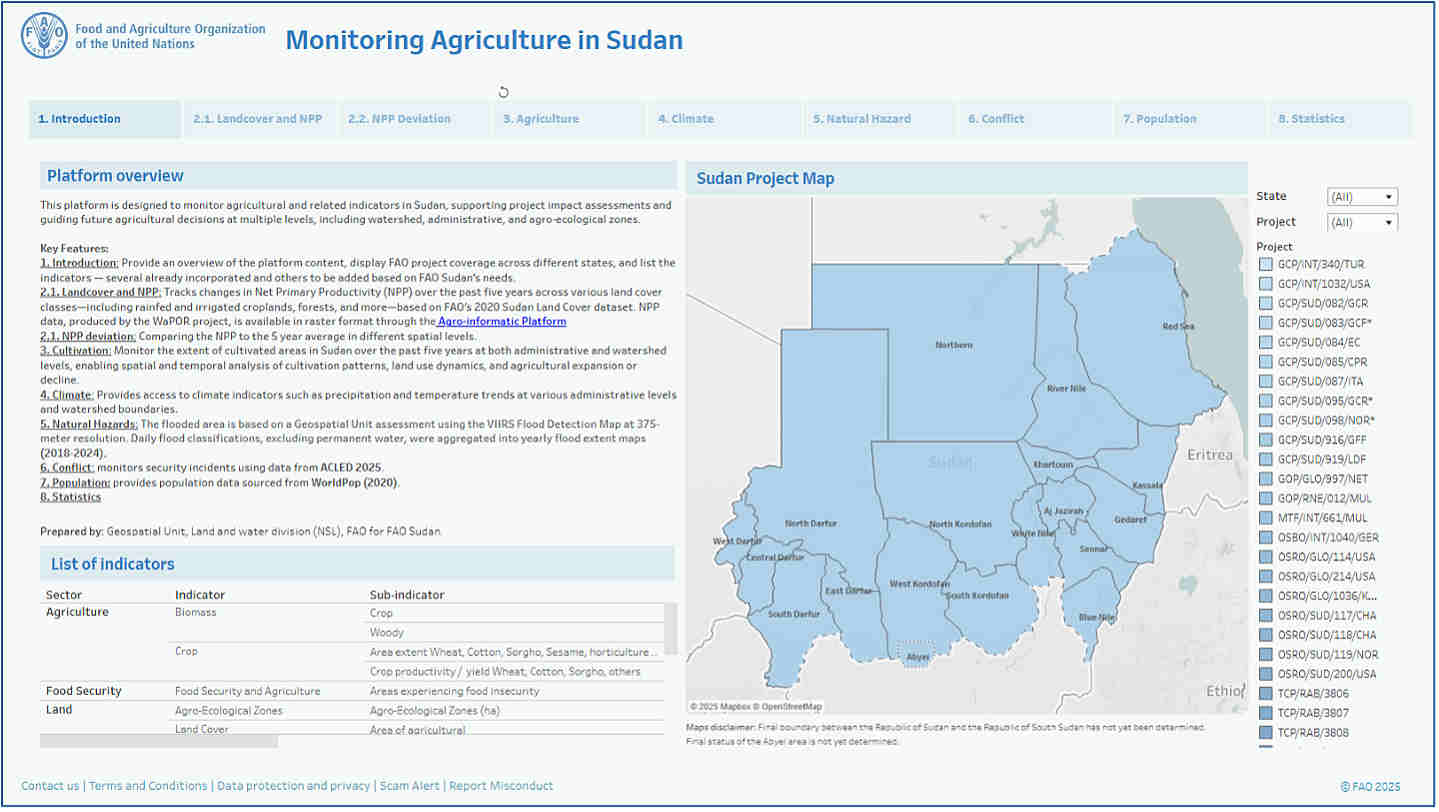
Source: Authors’ own elaboration based on project coverage from the FAO Representation in the Republic of the Sudan.
The AMP supports agricultural monitoring and decision-making through a suite of integrated features. It includes net primary productivity (NPP) tracking using WaPOR version 3 data, which monitors carbon productivity across various land cover types over the past five years, allowing for early detection of stress at the watershed and locality levels. FIGURE 28 illustrates monthly deviations in NPP from the five-year baseline across different land cover types.
FIGURE 28 Monthly monitoring of carbon productivity (NPP) deviation from baseline across different land cover types
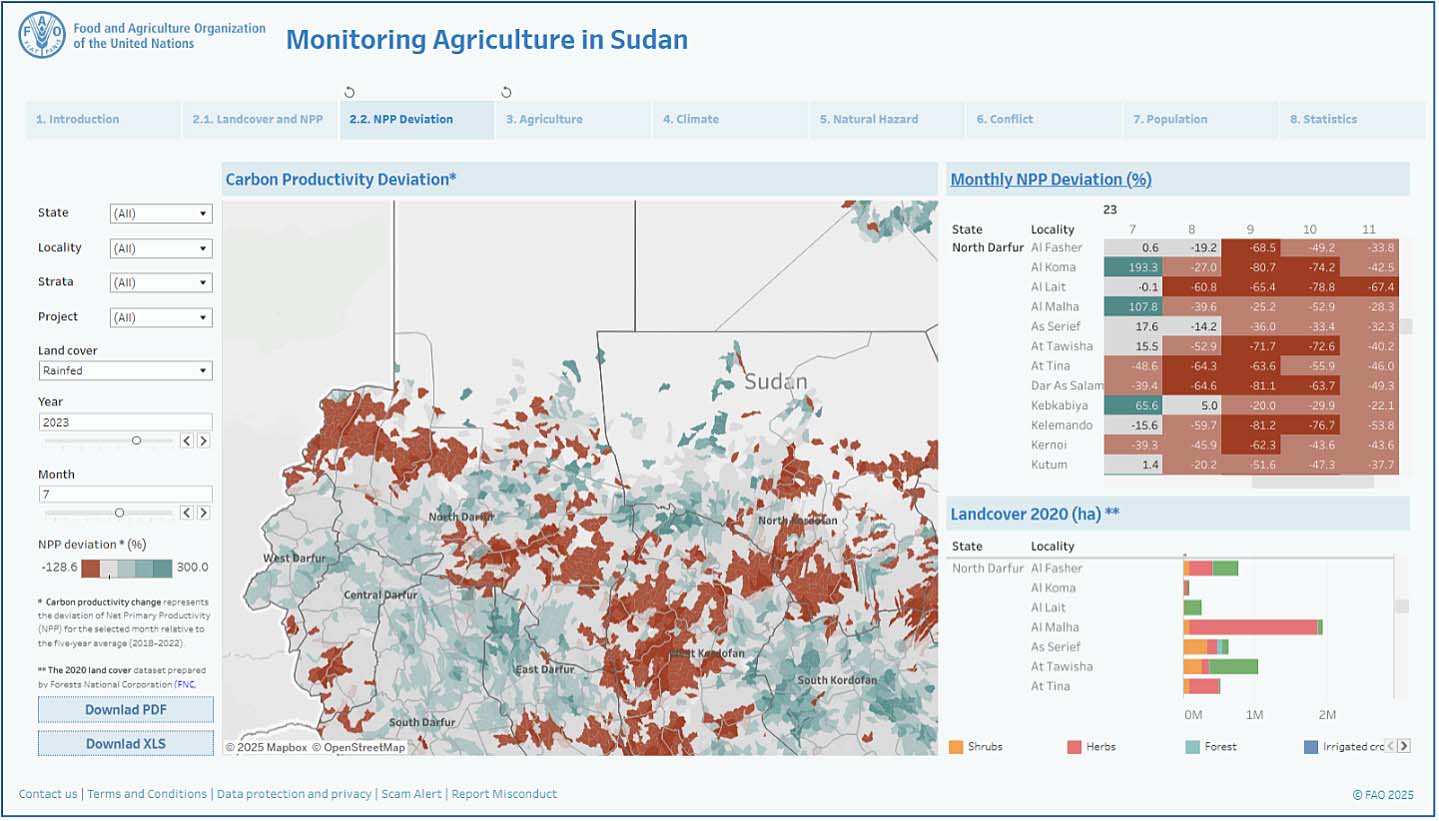
Sources: FAO. 2019. WaPOR Database methodology: Level 3 data – Using remote sensing in support of solutions to reduce agricultural water productivity gaps. Rome. https://openknowledge.fao.org/handle/20.500.14283/ca3750en; and FNC (Forests National Corporation). 2021. Republic of Sudan National Land Cover Map: 2020 Report. Khartoum. https://www.fao.org/fileadmin/user_upload/faoweb/Themes__pages/Forests/REDDNFM/Sudan_MRV/Sudan_NFMS_Action_Plan.pdf
The platform also incorporates a detailed flood analysis, covering five recent years (2018–2024), based on remote sensing to assess flood extent and duration. In addition, climate analytics provide monthly rainfall trends for the last five years using Climate Hazards Group InfraRed Precipitation with Station data, supporting the evaluation of precipitation variability. The crisis and security tracking component visualizes conflict patterns using armed conflict location and event data (ACLED) data, updated through 2025, enabling users to assess the potential impact of insecurity on agricultural systems. Lastly, the platform includes socioeconomic data, such as population estimates, aggregated at the watershed level, with plans to integrate additional layers, like displacement and returnee data.
Currently in its draft stage, the AMP’s features are designed for continuous enhancement. This multilevel approach enables tailored decision-making across administrative, watershed and agroecological zones, enhancing accessibility for national policymakers and localized project stakeholders. The AMP aims to visualize key data as a basis for risk monitoring. The Sudan faces simultaneous challenges of natural hazard-induced disasters, particularly floods and national conflicts. These challenges significantly impact agriculture and food security, especially smallholder farmers who lack timely, localized risk information. The AMP addresses this by mapping flood-prone areas and the locations of crisis events, and monitoring agricultural productivity and historical climate indicators. Its interactive dashboards and region-specific maps allow stakeholders to monitor the impacts of specific projects and the effects of disasters or conflicts. This facilitates informed decision-making and more effective resource allocation. The AMP supports targeted interventions by identifying high-risk areas and providing real-time, actionable data. This empowers smallholder farmers to make informed decisions on irrigation, planting and resource allocation.
To complement these capabilities, more detailed remote sensing analysis integrates high- and very high-resolution crop monitoring across key agricultural zones. This includes time-series assessments of land use, crop growth and cultivation patterns, with a focus on strategic areas such as the Gezira Irrigation Scheme. Using vegetation indices and satellite-derived productivity metrics, the analysis tracks shifts in major crops like wheat, sorghum and cotton – particularly under the pressure of conflict and environmental challenges.183 In 2024/25, the cultivated area fell by 57 percent, with wheat declining by 68 percent in area and 72 percent in productivity. 184 These outputs enrich the AMP’s capacity to detect risks and guide decision-making, offering an evidence-based foundation for targeting interventions, optimizing resources, and supporting smallholder farmers under crisis conditions.
Predictive analytics for agricultural monitoring
Reliable and timely data on crop yields is essential for short-term cereal supply and demand outlooks, which play a pivotal role in triggering anticipatory actions to mitigate the impact of production shocks, volatile markets and food insecurity. Risk monitoring platforms can facilitate the tracking of global food supplies and production, and the alteration of adverse conditions, thus supporting decision-making.
The Group on Earth Observations Global Agricultural Monitoring Initiative (GEOGLAM) crop monitor is one of these tools.185 However, access to data from platforms such as GEOGLAM remains a challenge, particularly in regions with limited infrastructure, logistical barriers, conflict and high costs. To address these gaps, digital innovations such as FAO’s ML-based prediction method using remote sensing data to predict crop yields are being developed. This represents a step forward in bolstering the reliability, accuracy and interpretability of crop yield forecasts. A key advantage of these models is their spatial applicability, for example, in areas that are difficult to access, such as conflict-affected regions. Through collaboration with universities and research institutions, FAO is pursuing the integration of these methods and data into existing analytical frameworks, addressing critical gaps in standard approaches and enhancing their practical impact.
These models and their outputs have already demonstrated their value in Southern Africa during the 2024 El Niño-induced drought. FAO provided ML-based yield forecasts to country offices and national governments three months prior to the main harvest period. These quantifiable early warnings enabled more effective drought impact assessments and advocacy for large-scale responses. Additionally, the yield data contributed to an integrated region-wide assessment that combined household survey data and remote-sensing forecasts, improving the accuracy of damage and loss estimates.
Tools such as WFP’s Economic Explorer186 and FAO’s online FPMA187 help in predicting and tracking market prices, supporting early warning and better disaster preparedness.188 These can help farmers in monitoring market conditions and obtaining alerts on price spikes that threaten food security. The FPMA tool offers weekly and monthly updates to over 2 500 domestic price series across 120 countries and 89 international food and agricultural input reference prices. This enables market participants to analyse trends, helps policymakers design effective interventions, and offers researchers access to vast amounts of data about food market dynamics. The integration of the United Nations Sustainable Development Goal 2.c.1 price anomaly indicator within the FPMA tool allows governments to monitor abnormal price fluctuations that could undermine food affordability. The FPMA tool fosters informed decision-making (by providing digitalized data and enhancing accessibility through APIs), strengthens food security and enhances the resilience of global and local food systems.
Beyond crop yields and price data, advances in the application of predictive analytics occur also for other areas, such as meteorological and hydrological hazards. Flood Hub189 and Flood Forecasting190 models from Google, for example, are tools under development that support flood predictions in ungauged watersheds, fostering more quality data generation.191
Near-real-time impact assessment
Decision-makers need quick, reliable and granular data on various dimensions of the hazard-related impacts to inform timely and impactful emergency response and recovery frameworks. Many challenges arise when these dimensions are applied to the agrifood sector. Risk and impact analysis requires a coherent understanding of biophysical and socioeconomic factors, which is often missing, leading to incomplete assessments, particularly for impact pathways and post-hazard needs of affected communities.
However, data is often incomplete and fragmented. Lack of data literacy and accessibility also hinders the uptake of existing information systems. Adoption is also limited when data comes late, after critical decisions such as appeals and resource allocations have been made, or when the data is not granular at the decision-making level (administrative level, population, livelihood profile). Additionally, difficulties in accessing affected areas and populations result in expensive and delayed data collection that does not align well with decision-making needs. To overcome these challenges, WFP has developed the Platform for Real-Time Impact and Situation Monitoring (PRISM).192 PRISM integrates layers of vulnerability data to support the analysis of climate hazard impacts on food security, ensuring that the most vulnerable populations exposed to hazard-induced disasters are prioritized.
PRISM makes use of AI models to analyse historical weather data, satellite imagery, and real-time meteorological inputs, from sensors and IoT devices, to forecast weather events and to provide early warning alerts. Post-disaster damage assessments can be done quickly using satellite and drone imagery, combined with other socioeconomic data sources as seen in Myanmar and the Philippines.193
In collaboration with Google Research, WFP has developed SKAI, an AI and satellite imagery application to enable real-time insights and knowledge for effective decision-making in disaster response.194 Fusing cutting-edge ML algorithms and vast satellite data, SKAI empowers organizations to make data-driven decisions (for example rapid building damage assessment, situational awareness and resource allocation), with precision and speed. This technology can be 13 times faster and 77 percent cheaper in near real-time post-disaster building damage assessment operational situations and has been used in disaster response during the Türkiye and Syrian Arab Republic earthquake (2023), Hurricane Ian (2022) and the Pakistan floods (2022).195
FAO’s WaPOR is a platform hosting an innovative near-real-time database of satellite data that support disaster impact assessment.196 The WaPOR platform provides timely, high-resolution, and spatially comprehensive data that is useful for pre-disaster risk mapping, real-time monitoring, damage assessment, environmental impact evaluation, humanitarian assistance planning and long-term recovery. 197
The Events Visualization in Emergencies (EVE) system, developed in the Data in Emergencies programme uses satellite-derived and open-access data for the humanitarian sector.198 EVE’s open-access data approach is complemented by adherence to international Office for the Coordination of Humanitarian Affairs (OCHA) place codes, facilitating direct integration into humanitarian contexts and data workflows. Covering several countries (approximately 40 as of December 2024), with the flexibility to include additional countries during rainy seasons or at risk of flooding, EVE provides insights into flood events at both the granular and regional levels (see FIGURE 29). These insights empower organizations to make informed decisions quickly and accurately by offering intuitive interfaces and actionable information tailored to the fast-paced needs of emergency contexts.
FIGURE 29 Visualization example from Events Visualization in Emergencies, showing flood persistence across cropland in Taraba State, Nigeria, October 2024

Source: Authors’ own elaboration based on FAO. n.d. DIEM event viewer. [Accessed on 1 August 2025]. https://data-in-emergencies.fao.org/pages/diem_eve.
Open-access data approach by EVE ensures scientific reliability while maintaining transparency and integration with other systems. EVE data sources include: Visible Infrared Imaging Radiometer Suite (VIIRS), which delivers daily, global and near real-time flood detection at 375-metre resolution;199 European Space Agency (ESA) WorldCover, which identifies land cover types such as cropland, enabling targeted impact assessments with 10-metre resolution;200 and population density and subnational administrative boundaries, which provide population exposure estimates and ensure data alignment with standards for emergency coordination (e.g. OCHA place codes).
EVE also uses an integrated technology stack for processing and analysis. This includes Google Earth Engine, which harnesses Google’s cloud-based computational infrastructure to support large-scale geospatial analysis and perform complex geoprocessing operations efficiently. It enables EVE to process massive datasets rapidly. Python is used for data engineering and statistical processing, while ArcGIS Online provides intuitive, interactive dashboards for effective visualization.
EVE is versatile and tailored to meet the needs of diverse users. It provides an initial understanding of flood impacts on agriculture, helping government agencies, international organizations and NGOs to frame and triangulate field assessments and guide operations. EVE’s user-friendly dashboards enable the exploration of flood dynamics over time and space, at scales ranging from multicountry regions to administrative levels 1 and 2. Since becoming operational in September 2024, EVE’s outputs have significantly contributed to disaster response and long-term planning by FAO and other partners.
Linking early warning to anticipatory action
EWS are increasingly improving at predicting hazards threatening livelihoods and food security. This can help deliver finance for protecting livelihoods from hazard impacts, therefore speeding resilience-building. Innovative applications of EWS data are under development to meet this goal. Mobile technology can enable rapid identification of at-risk populations and deliver targeted warnings, amplifying the reach and effectiveness of preparedness efforts, for example as was the case in Bangladesh and Nepal.201
FAO provides technical support to countries for the development of sound trigger mechanisms for anticipatory action, leveraging the most advanced technologies and promoting participatory and context-specific approaches. For example, in Somalia,202 El Niño-induced flooding during the 2023 Deyr rainy season (October–December) affected an estimated 2.48 million people. Informed by an evidence-based EWS, primarily through the Somalia Water and Land Information Management Project’s (SWALIM) flood model, in June 2023 FAO delivered anticipatory actions in partnership with the national government and humanitarian actors. Anticipatory actions included timely early-warning information, investments in flood defence infrastructure, prepositioning of sandbags, and coordination of evacuation and contingency planning with governments and local communities in key areas along the Shabelle and Juba Rivers. Ninety percent of at-risk populations were evacuated on time and river embankment rehabilitation in Beletweyne district held back flood waters for up to one week, enabling communities to move safely.
Innovative digital solutions are also needed to better target the at-risk vulnerable households, to speed up delivery and improve assessment prediction accuracy (for instance, the EVE tool presented earlier in this chapter could be used to assess flood prediction accuracy through satellite data).
BUILDING RESILIENCE THROUGH DIGITAL INNOVATION
Digital technologies can provide effective, timely, appropriate and sufficient support to farmers, assisting them in avoiding poverty and food insecurity. Indeed, these tools facilitate access to critical provisions, supporting risk transfer, reducing impact and improving coverage. They also increase livelihood resilience and improve social cohesion by fostering community relationships.
Agricultural insurance innovation
Agricultural insurance is a strong modality for providing safety nets for farmers.203,204 Digital tools play a fundamental role in agricultural insurance, particularly in risk index insurance and in providing affordable products and services to individual farmers. By creating more fine-tuned risk indexes, lowering administrative costs, reducing human error and providing more objective assessments of damage, digital solutions reduce premium costs of agricultural insurance – a significant limiting factor for farmers. Digital technologies are also being leveraged for financial education and knowledge transfer, as well as for information provision on DRR and climate-resilient farming practices and more efficient use of agricultural inputs and seed choices. Using mobile money channels to digitize client registration, claim upload, and payout deliveries can strongly reduce the cost and time associated with these processes. This is particularly critical when it comes to expanding coverage among clients from rural areas.
The use of automated algorithms to assess the risk profiles of different subsegments of farming populations increasingly supports the provision of up-to-date, granular and precise data on small-scale farmers (e.g. in terms of their income flows, financial needs and value chain dynamics), putting private insurers in a position to engage with the agricultural sector. By leveraging a wide range of both quantitative and qualitative data points – such as satellite imagery of farms or interviews with neighbours – automated risk scoring systems can generate detailed profiles of potential clients. This reduces the risk for private insurers when providing coverage to these actors and helps lower premium costs.
The use of digital insurance technology (insurtech) in the agricultural sector carries the risk of widening the digital divide and further marginalizing those who, due to sociocultural and regulatory constraints, face greater barriers in accessing and using digital tools. In many developing countries, for example, rural women encounter significantly more obstacles than men in using mobile money services, owing to sociocultural expectations, lack of essential identification, and lower levels of digital literacy. As a result, efforts to expand agri-insurance coverage through Insurtech may inadvertently lead to further financial exclusion, with male farmers becoming the primary beneficiaries of innovation. It is therefore essential to consider these structural constraints when designing, delivering and evaluating digital insurance products, and to ensure equitable access for all.
Founded in 2015 in Kenya, Pula Insurance Advisors is an insurtech company that focuses on developing digital parametric insurance products for small-scale farmers in climate shocks-affected contexts.205 Pula operates by establishing end-to-end partnerships with a wide range of stakeholders, such as insurance companies, agricultural technology companies, commercial banks, government entities, development agencies, agri-input dealers and other providers. It aims at fostering collaboration to bridge critical demand- and supply-side gaps that normally prevent insurance for smallholder farmers. Pula is present in 13 countries in sub-Saharan Africa. In 2021, the company began implementing its model in Cuba, Indonesia, Pakistan and the Philippines.
Pula employs several instruments to achieve a balance between profitability and affordability. First, it uses mobile-based registration systems (both app- and SMS-enabled) to register new users in a rapid and efficient manner. Second, it leverages automated learning algorithms that can group together agricultural producers whose farms share similar features. Third, Pula uses digital tools to automatically evaluate reimbursement claims from the field, greatly increasing efficiency and ensuring that payout claims are settled and delivered to the farmers within 5–7 weeks. Compared to most existing index-based insurance schemes, this represents a significantly short settlement period.
As of mid-2023, Pula had insured 9.1 million farmers, for a gross premium of USD 69.1 million, ensuring coverage for approximately 4.4 million hectares of land across 17 countries. Pula’s coverage resulted in payouts being delivered to 755 000 farmers as of mid-2023, with a total of USD 27.1 million in claims being disbursed. Pula’s approach of combining insurance with agricultural advice has shown impressive outcomes, with clients registering increased investments in their farms by up to 16 percent and significant yield improvements of up to 30 percent.
Livestock risk management tools
Large datasets support research, policy tracking, planning and decision-making, although turning data into risk-informed decision-making requires significant amounts of analysis and modelling. The Livestock Investment Rapid Appraisal (LIRA) aims to improve cost-efficient decision-making and to support wider applications at the institutional level.
The livestock sector is vital for global agrifood systems, livelihoods and economies, but it is highly vulnerable to disasters, such as droughts, disease outbreaks and extreme weather. These events result in livestock mortality, reduced productivity and long-term economic damage, impacting household incomes and food availability. However, stakeholders often lack tools and data to assess risks and implement effective interventions. Without a clear assessment of impacts and benefits, decision-makers cannot optimize resource allocation, and private investment in resilience-building measures remains limited.
LIRA assessed the loss and damage of the 2016/2017 drought in Somalia. In 2017, after three consecutive seasons of insufficient rainfall, Somalia declared a national disaster. The World Bank, the United Nations, and the European Union conducted Drought Impact and Needs Assessments (DINAs), which considered only the drought year. In contrast to the DINAs, the LIRA assessment uses a modelling framework that compares a drought scenario with a no-drought scenario, based on pre-drought livestock population and production parameters. It covers five post-drought years and therefore accounts for longer-term losses resulting from the immediate loss and damage experienced during the drought year.
Risk reduction can also be conducted through anticipatory peste des petits ruminants (PPR) (also known as sheep and goat plague) vaccination. PPR is a highly contagious viral disease that can cause high morbidity and mortality in small ruminants such as sheep and goats. The disease can cause significant economic losses, therefore vaccination is vital to respond to PPR epidemic risks. The cost and benefit assessment of anticipatory PPR vaccination has been based on the baseline scenario from the previous ex-post loss and damage assessment. In a normal year, a sheep/goat is estimated to generate a return of around USD 21. In the case of an outbreak of PPR, annual returns are estimated to decline by around 40 percent, mostly due to increased mortality.
PPR vaccination has an average benefit–cost ratio (BCR) of 16, indicating a highly attractive investment. It breaks even – achieving a BCR of 1 – at a vaccination cost of USD 3.7 per animal, an expected loss of USD 0.60 per animal, or a disease risk of 3.6 percent. These break-even thresholds strongly suggest that vaccinating goats against PPR is highly likely to cover its costs and remains economically viable even if livestock keepers must bear the expense themselves.206
LIRA empowers stakeholders to make informed decisions, mitigating risks and fostering sustainable development. The potential of LIRA could be expanded by increasing the scope and volume of data available, as well as by including metrics for livelihood and environmental impacts. In this regard, the Livestock Intervention Coordination System (LICS) offers information that can further inform LIRA.
Integration with social protection systems
Social protection comprises a set of policies and programmes that addresses economic, environmental, and social vulnerabilities by protecting and promoting livelihoods. Through its preventive, protective, and transformative functions and the delivery of cash and/or in-kind support, social protection helps tackle vulnerability to poverty and food insecurity, to avert losses of income, livelihoods and assets, and to build resilience against disasters and crises. It also supports asset accumulation, invests in human capital, provides a buffer for the uptake of climate-smart agricultural practices and climate adaptation activities, stabilizes incomes and ensures access to credit.
Traditionally, social protection systems have been designed to address risks faced by individuals and households, but recent efforts are devoted to leveraging them for reducing or managing covariate shocks. Covariate shocks are those affecting a wide number of households in a specific geographic area, such as drought, floods and conflict. In this latter case, covariate shocks are called “shock responsive” or “adaptive” social protection systems,b which facilitate and complement DRM interventions.
Utilizing social protection systems to complement DRM efforts involves leveraging specific components of the delivery chain, including data, digital, communication and delivery solutions. For instance, social protection management information systems (i.e. social or beneficiary registries) can be overlayed with shock-related risk and vulnerability datasets, or livelihood-specific information from farmer registries, to improve recipient identification and target interventions.
Finally, social protection payment and service systems provide a key avenue to complement or channel DRM interventions. Cash assistance from social protection systems is often disbursed through a combination of channels, including physical cash or electronic payments (e.g. mobile wallets and payments). Kenya’s M-Pesa facilitated quick and efficient relief payment of USD 7 million to 1.1 million beneficiaries during the 2017 drought. An example of the reaching scale of these systems is the Social Cash Transfer Programme by the Government of Malawi. In 2022 it provided cash support to 74 000 households ahead of a particularly poor lean season.207 Digital payments help mitigate risks associated with physical cash disbursements and significantly reduce transaction costs. In Kenya, mobile wallets enable beneficiaries to safely and securely access their funds for immediate use on basic needs. They also allow for real-time recipient verification and provide an audit trail that helps reduce corruption risks and inefficiencies during implementation.
Supporting improved disaster impact data collection
Drones and UAVs are emerging as an excellent tool for data collection for DRR, together with high-resolution satellite imagery. The range of applications of drones in agriculture is extensive.208 At the meso-level, governments (national, subnational and supporting agencies) are finding innovative applications for drones/UAVs in disaster impact assessment. UAVs have been crucial in providing rapid, high-resolution and insightful data that helps in hazard mapping, damage assessment, planning interventions, surveillance and monitoring. The use of multispectral sensors on drones can capture plant health and detect disease, supporting both advisory services and data collection.
For example, in 2014, FAO trained Libyan and Ethiopian policymakers and experts on the theory and practice of remote sensing (including UAVs) application on water infrastructure management. Trainees learned to operate drones and interpret and apply related data for monitoring and maintenance of critical water infrastructure, as well as spraying and multispectral mapping. These initiatives had relevant impacts. Drones enable rapid and precise monitoring of large areas, reducing the time and labour required for conventional methods. High-resolution data supported targeted interventions, minimizing resource waste while improving yields and infrastructure resilience. Despite these advances, challenges such as regulatory barriers, costs and integration into existing DRR frameworks remain.
Other examples of WaPOR’s role in such activities are taken from the Syrian Arab Republic and the Sudan.209 In 2019, the WaPOR supported the damage assessment of the Syrian Arab Republic’s irrigation infrastructure (dams, pumping stations and irrigation systems) due to the ongoing conflict. By analysing plant growth and water usage through WaPOR’s Actual Evapotranspiration (AETI) layer, areas where irrigation infrastructure had survived were identified. In semi-arid regions like Deir Ez-Zor, AETI was effective in detecting irrigation activity by tracking water loss via evaporation, transpiration and interception, providing vital information on the state of agricultural systems. Understanding the impact of conflict on national agricultural investments was essential for the Ministry of Water Resources to assess damage and guide its reconstruction and resource mobilization efforts.
Similarly, in the Sudan, WaPOR data was used to assess the 2023 growing season and compare the season’s average with the previous five years, aiming to estimate the impact of the ongoing conflict on agricultural production.203 The assessment revealed a 51 percent reduction in cultivated areas at the start of the season compared to previous years, mainly due to disruptions in markets and financing mechanisms that hindered farmers’ access to agricultural inputs. WaPOR data was used to inform an agricultural seeds distribution programme, enabling more farmers to plant on time for the growing season. This demonstrates that remote sensing data, such as WaPOR, can provide co-benefits in monitoring the impact of conflicts on agriculture and supporting humanitarian responses.


